View the routing cache and hits

Most of us check the normal thinks like traceroute or arp on a web server, but actually checking recent routing table lookup's can be a great tool. Doing this you can see if your actually using the right interface or if the application is even requesting the traffic to be routed by your OS.
When debugging a networking issue it can be invaluable to see your linux servers current routes to get an idea of what's going on, also you can view the number of hits these routes have recently gotten, just look in the use column of the output table.
route -neeC
You should see something like the following output:
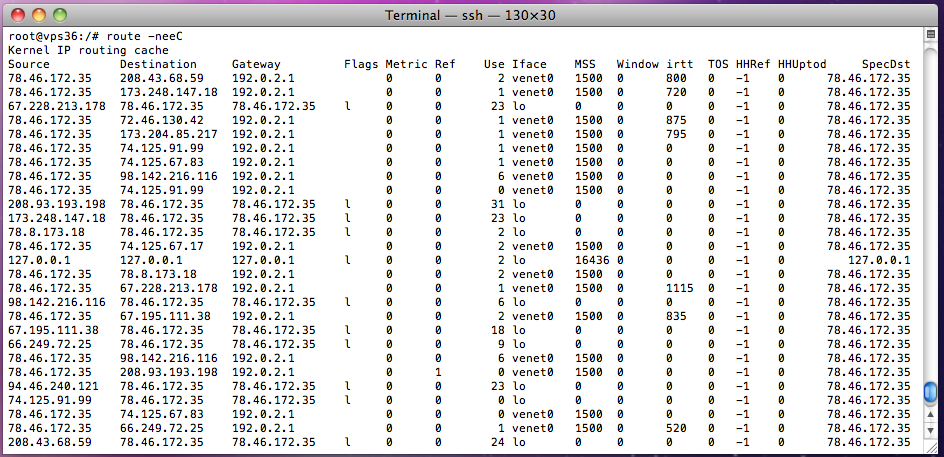
root@:/# route -neeC
Kernel IP routing cache
Source          Destination     Gateway         Flags Metric Ref    Use Iface    MSS   Window irtt  TOS HHRef HHUptod     SpecDst
78.46.172.35    208.43.68.59    192.0.2.1             0      0        2 venet0   1500  0      800   0   -1    0      78.46.172.35
67.228.213.178  78.46.172.35    78.46.172.35    l     0      0       23 lo       0     0      0     0   -1    0      78.46.172.35
78.46.172.35    72.46.130.42    192.0.2.1             0      0        1 venet0   1500  0      875   0   -1    0      78.46.172.35
82.103.128.63   78.46.172.35    78.46.172.35    l     0      0       23 lo       0     0      0     0   -1    0      78.46.172.35
78.46.172.35    174.34.156.130  192.0.2.1             0      0        1 venet0   1500  0      735   0   -1    0      78.46.172.35
From the above we can see some very interesting stats such as the interface used, source and destination IP's, metric, number of 'uses' and even the interface MTU